AI Infographic Generator — Turn Your Notes and Numbers into One Image
AI infographic generator by Image to Layers turns your notes, numbers or a spreadsheet screenshot into one infographic image laid out as stats, charts, a comparison, list or explainer.
Paste your points, pick a layout, and generate one image. Check every number before you publish.
10–700 characters. Paste a summary, not a whole PDF. Write numbers exactly as they should appear.
Layout
A bold headline, then each figure as a huge number with a one-line label, on a light background with one accent color.
Screenshot or logo (optional)
Model
Resolution
Aspect ratio
Your points, laid out as one image
Sample of the Big numbers layout. Your image is drawn from your own content and the layout you pick.
1 AI image modelText & reference workflowsModel-aware settings
AI infographic generator gives students, teachers, marketers and small creators a ready-to-post infographic image for a slide, handout or social post instead of an editable design file. Each image uses Nano Banana 2 and costs 24, 26, 28 credits at 1K, 2K or 4K; there is no free generation, and packs start at $5. Downloads have no added watermark; check every number and word before you publish.
Updated
How the AI infographic generator works
AI infographic generator works in three steps: paste up to 700 characters of content, choose a layout card, then pick the size and aspect ratio and generate one image. A screenshot is optional; with it, the prompt asks the model to read its text and numbers as extra content. A title plus three to seven short points reads best.
01
Paste your content
Write a title and the key points or numbers, up to 700 characters. The prompt asks the model to use only these words and figures.
02
Pick a layout and an optional image
Choose Big numbers, Charts, Comparison, Numbered list, Explainer or Custom. Add one PNG, JPEG or WebP screenshot or logo up to 10 MB if you want it used.
03
Generate and download
3:4 suits a poster or LinkedIn post, 9:16 a story, 2:3 a Pinterest pin and 16:9 a slide. Sign in, check the credits on the button, generate, then download.
AI infographic generator examples by layout
AI infographic generator examples below pair the content that was given with the layout it fits, so you can see what each card changes: the arrangement, the chart types, the colors and how much illustration surrounds the text. These five images are layout samples, not results from your content; every new image is drawn again and will differ in layout and detail.
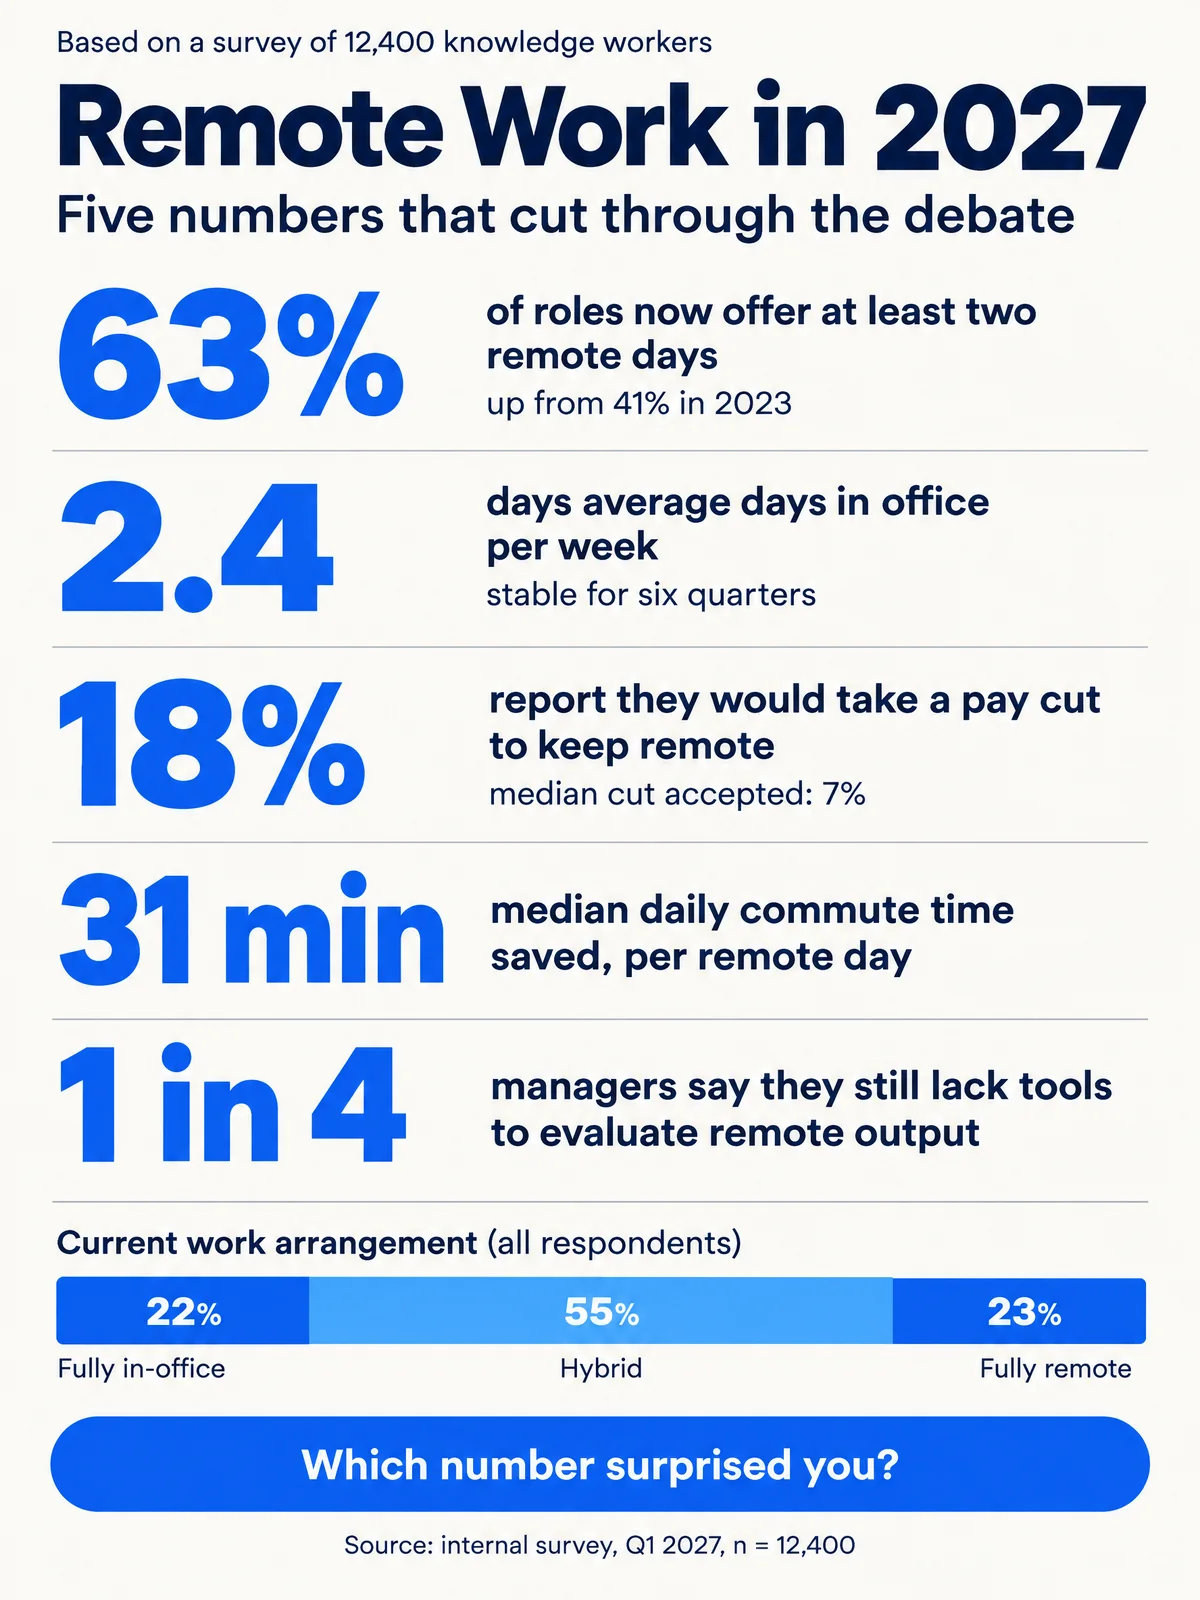
Survey results as big numbers
Layout: Big numbers
Content: Remote work in 2027: 63% of roles offer two remote days (41% in 2023), 2.4 office days a week, 18% would take a pay cut, 31 minutes of commute saved.
Five figures stacked as huge blue numbers with one-line labels and a three-part bar for work arrangements, 3:4. The second label repeats the word “days”, a reminder to proofread every result.
Screenshot ↓ infographic
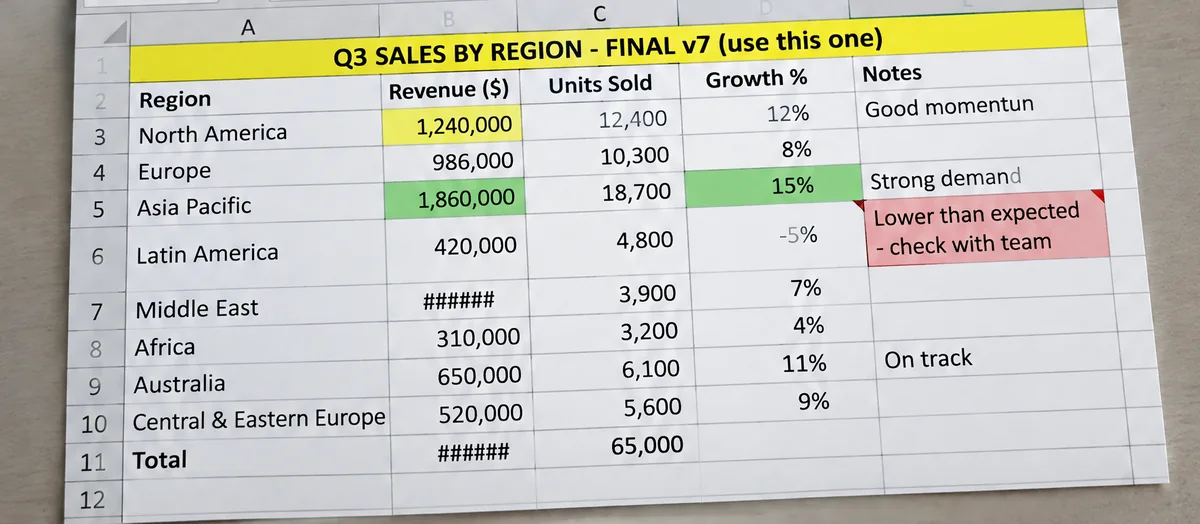
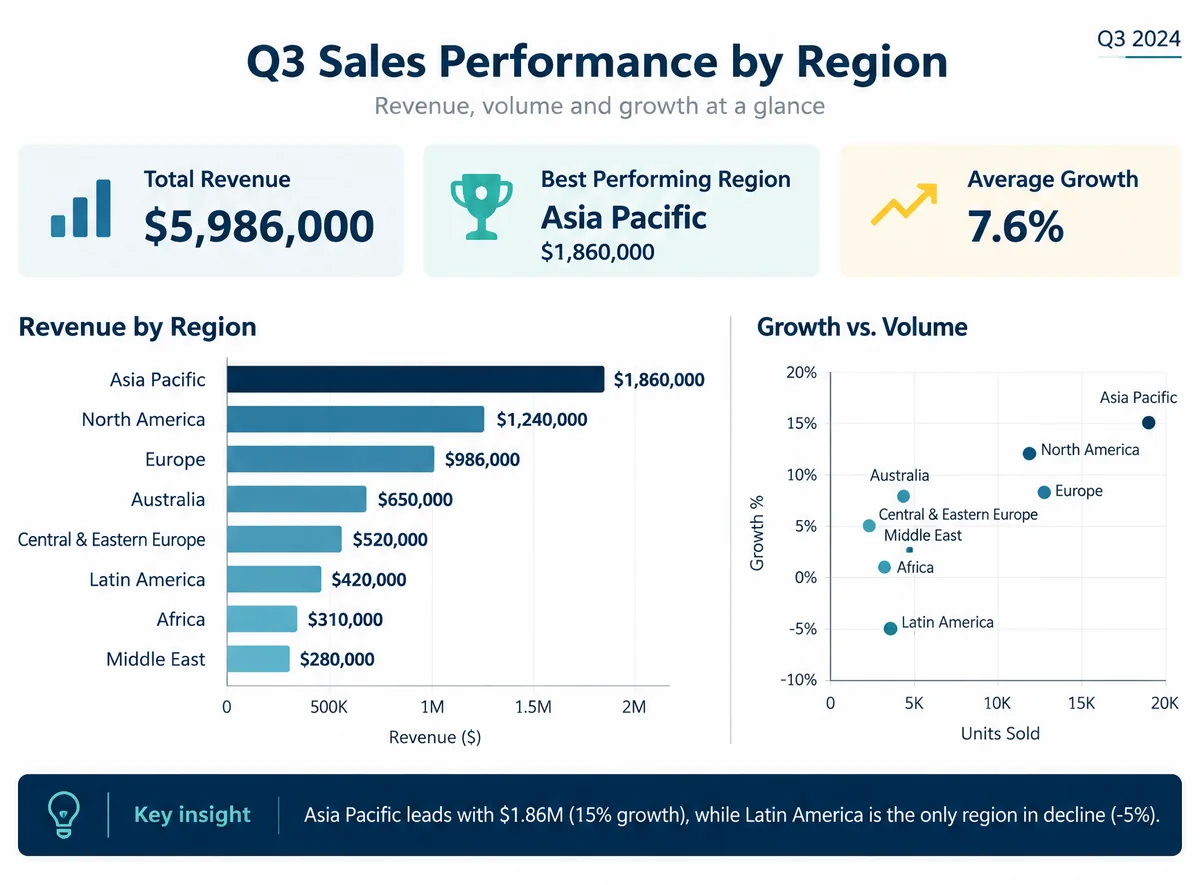
Spreadsheet screenshot to a sales chart
Layout: Charts
Content: A photo of a Q3 sales-by-region spreadsheet with revenue, units sold, growth and notes columns.
The same regions redrawn as three summary cards, a revenue bar chart, a growth-versus-volume scatter plot and a key-insight bar. The sheet showed ###### for two revenue cells, so the figures in the chart must be checked against the original data.
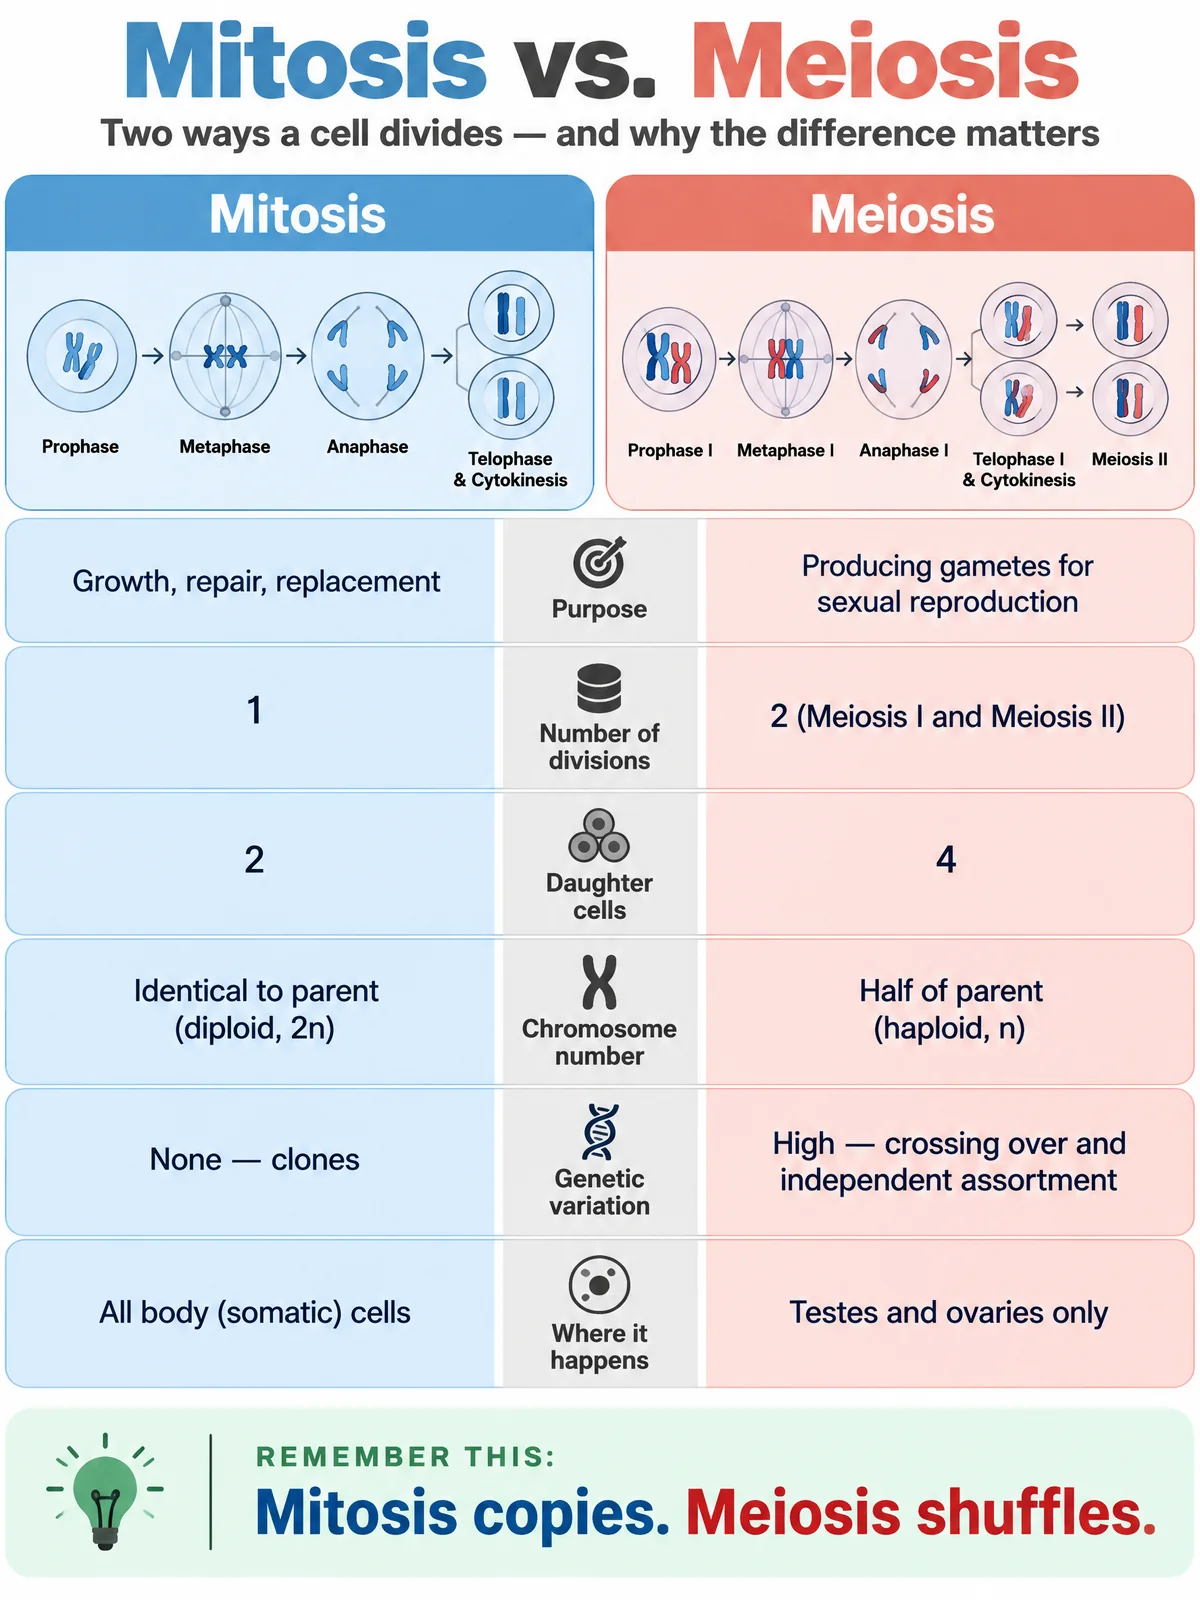
Two topics side by side
Layout: Comparison
Content: Mitosis vs meiosis: purpose, number of divisions, daughter cells, chromosome number, genetic variation, where it happens.
A blue and a coral column with stage diagrams on top, six matching rows with icons in the middle and a “Mitosis copies. Meiosis shuffles.” takeaway band, 3:4.
Seven tips for a social post
Layout: Numbered list
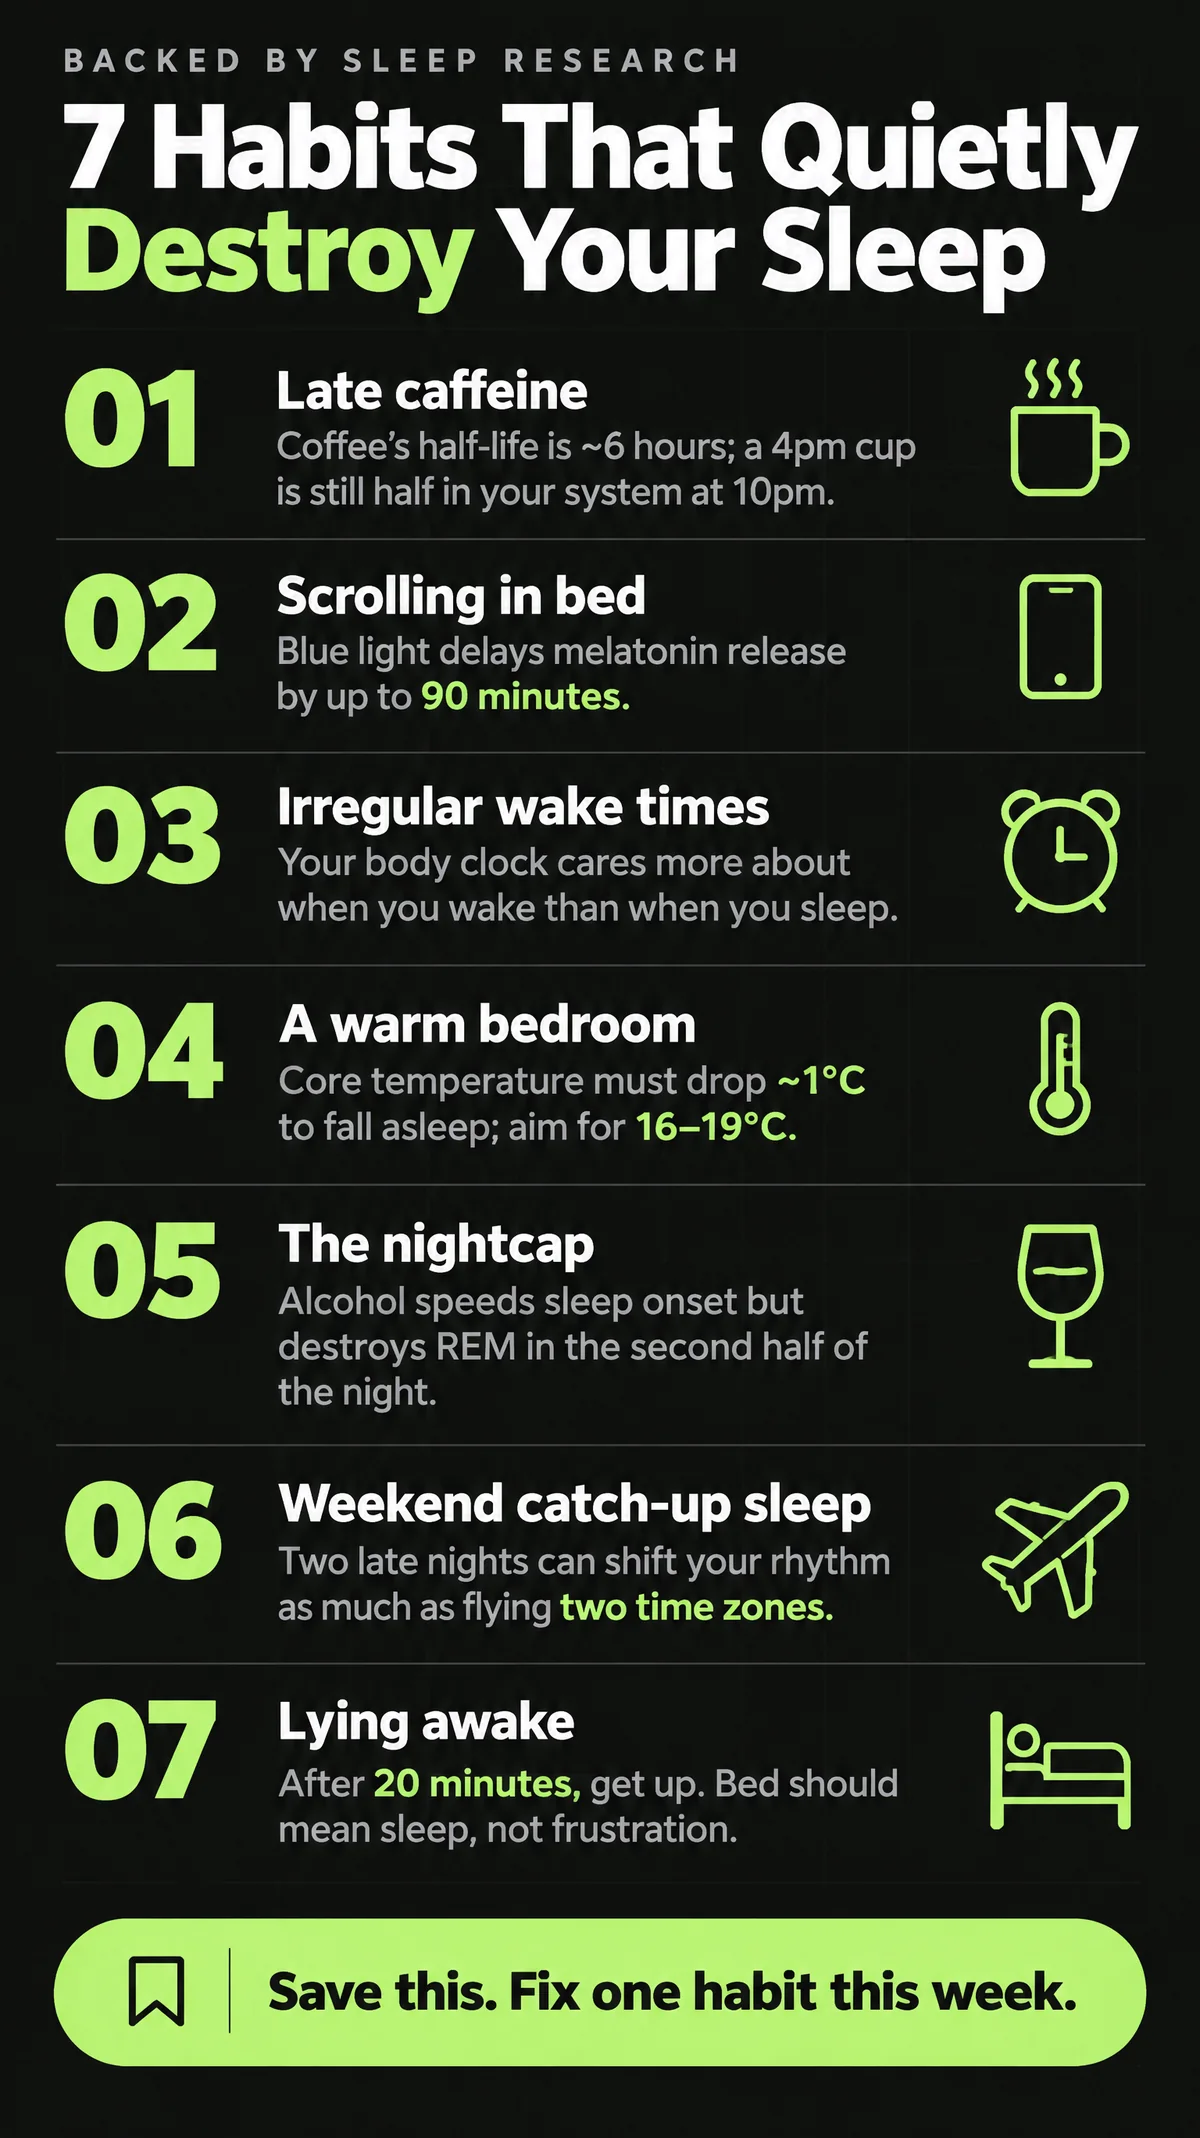
Content: 7 habits that hurt your sleep: late caffeine, scrolling in bed, irregular wake times, a warm bedroom, a nightcap, weekend catch-up sleep, lying awake.
Seven rows with lime 01–07 markers, a short explanation and a line icon each, on a black background with a “Save this” bar at the bottom, in a tall 9:16 frame.
Classroom explainer poster
Layout: Explainer
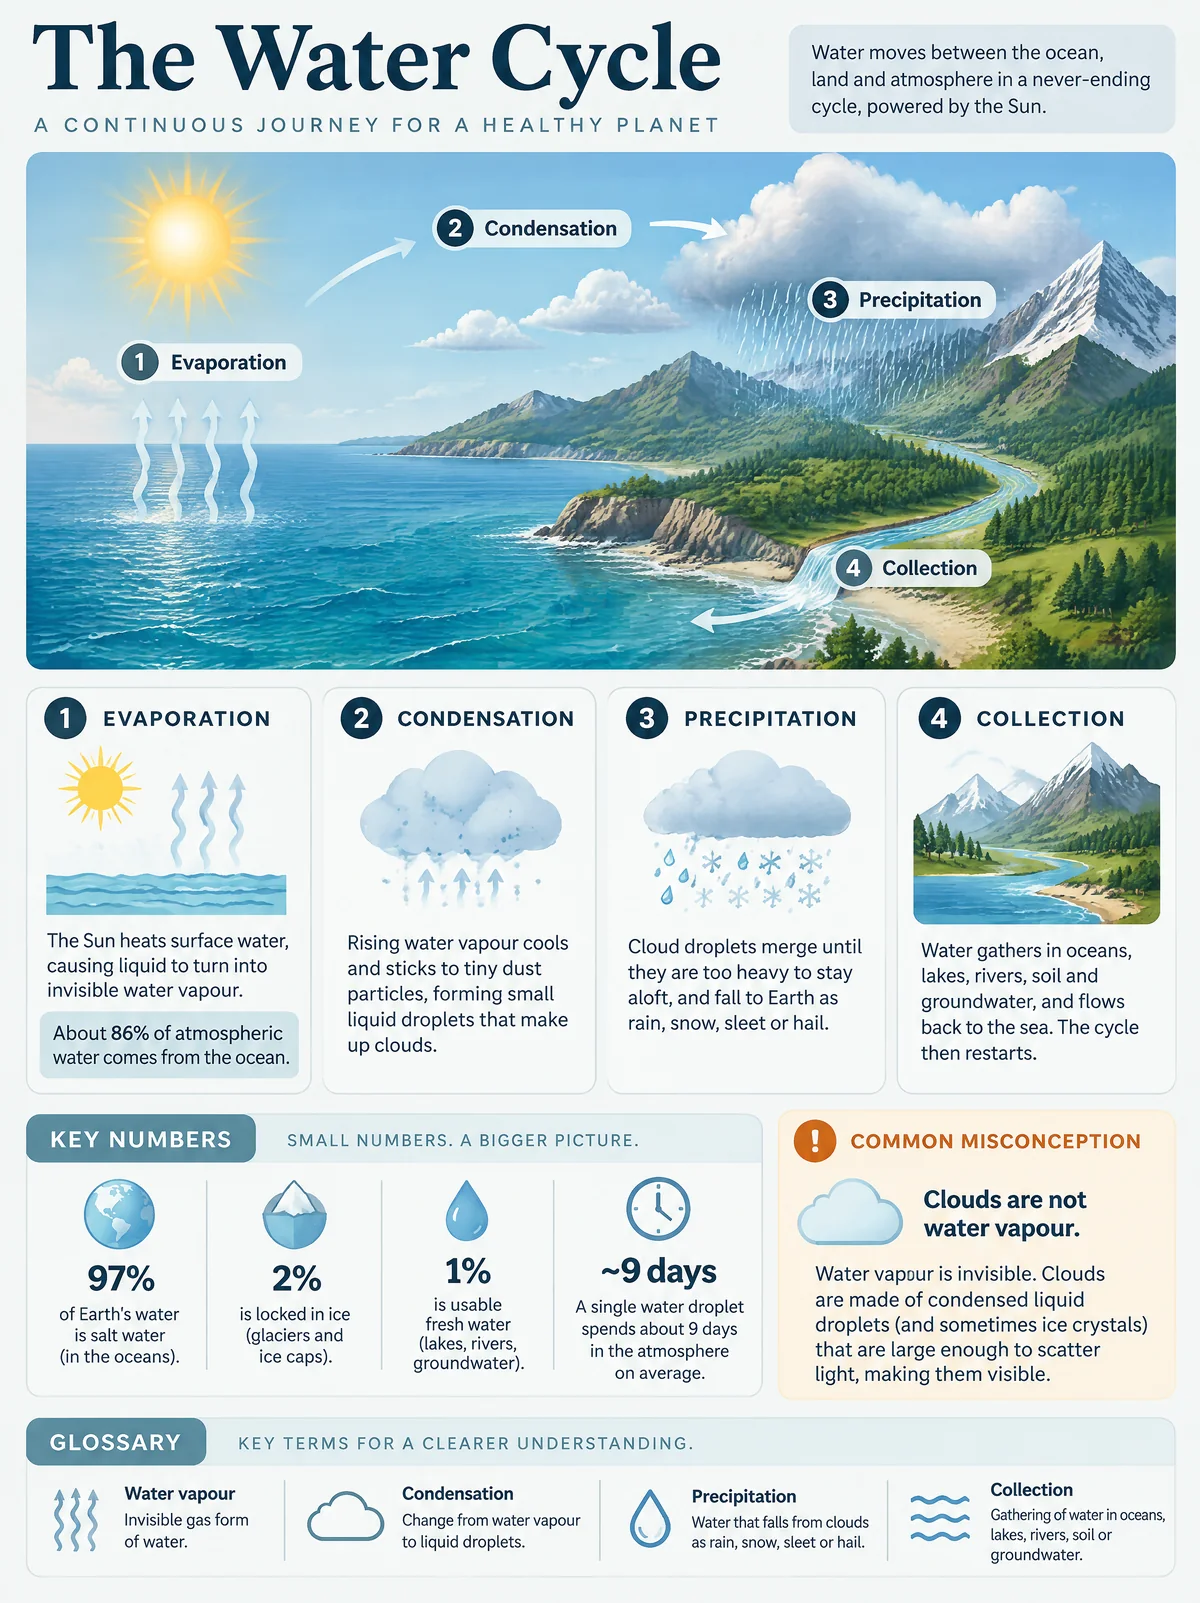
Content: The water cycle: evaporation, condensation, precipitation, collection; key numbers about salt water, ice and fresh water.
A painted coastline with four numbered stages, four step cards with small illustrations, a key-numbers strip, a misconception box and a glossary, 3:4.
How do I turn text or a PDF into an infographic?
An infographic from text starts with a short brief: a title, three to seven key points and the exact numbers you want shown, up to 700 characters. For a PDF or a long article, copy the summary paragraph or the key figures into the box rather than the whole document, because the tool does not read PDF files or web links.
Write numbers the way they should appear, such as 63% or $1.2M, and keep each point to one line. Long paragraphs are shortened into labels by the model and can lose meaning. If a chapter has more than seven points, split it into two infographics and use the same layout card for both so they look like a set.
Can it make an infographic from an image or Excel sheet?
An infographic from an image or an Excel sheet works through the optional upload. Take a screenshot or photo of the spreadsheet, chart, slide or handwritten notes, upload it as one PNG, JPEG or WebP file up to 10 MB, and add a title in the content box. The prompt asks the model to read the text and numbers in it and redraw them in the chosen layout.
The upload is read as a picture, not as data: cells hidden behind ###### or cut off at the edge of the screenshot cannot be read, and the model may estimate them. Crop the screenshot to the rows you need and type the most important figures into the content box as well. An Excel or CSV file cannot be uploaded directly.
Is this AI infographic generator free?
This AI infographic generator is not free: every image costs credits, starting at 24 credits for 1K, about $0.33 on the $19/1,400-credit monthly plan. From a zero balance, the smallest purchase is a one-time $5 pack of 100 credits, enough for 4 1K images. Writing content, picking layouts and viewing examples are free, and downloads carry no added watermark.
AI infographic generator credits per image
Output
Credits
Monthly equivalent
Download
1K · 1 image
24
$0.33
Included; no added watermark
2K · 1 image
26
$0.35
Included; no added watermark
4K · 1 image
28
$0.38
Included; no added watermark
Free generation
None. Writing content, choosing layouts and viewing examples are free.
Smallest purchase
$5 one-time for 100 credits
Generating needs a signed-in account so the credits can be charged; there is no guest or no-sign-up mode. For text-heavy designs with small labels, 2K or 4K costs only two or four credits more than 1K and keeps the small type sharper.
Each request makes one image. Failed tasks return the charged credits; generating again with the same content is a new paid request. See credit packs and plans.
How is this different from making an infographic in ChatGPT or Gemini?
The AI infographic generator on Image to Layers makes the same kind of output as asking ChatGPT or Gemini for an infographic picture: one flattened image, not an editable design. Image to Layers is an independent site that sends your content to Google's Nano Banana 2 image model (Gemini 3.1 Flash Image) through the APIMart API. What it adds is a fixed layout per card, rules against invented numbers, and chosen size and aspect ratio.
You do not need to write a long prompt: the layout direction and the accuracy rules are added on the server, and you only supply the content. You pay per image instead of a chat subscription. If you need to edit the text, move blocks or change a font after generating, an editor-based tool that exports a layered design suits that job better.
What the AI infographic generator cannot do
The AI infographic generator cannot guarantee that every number, word and bar length is correct. The prompt asks the model to copy figures exactly and draw charts in proportion, but long content, small labels and many numbers make mistakes more likely. It cannot read PDF files, web links or Excel files, and it does not produce editable, animated or interactive infographics.
Outputs are flattened PNG, JPEG or WebP images, not editable text, SVG or layered files. Each request makes one image, so a multi-page or carousel set needs one request per page. Faces and logos in an uploaded image are redrawn by the model and can change. For a flowchart or system diagram rather than an infographic, use the AI diagram generator; to turn a finished image into separate editable layers, try Image to Layers.
AI infographic generator FAQ
What is an infographic?
An infographic is a single image that explains a topic with a short title, a few key facts or numbers, simple charts and icons, arranged in a clear reading order. Teachers use them as handouts, marketers as social posts and teams as one-page summaries of a report.
Which aspect ratio should I pick for LinkedIn, Pinterest or PowerPoint?
Pick 3:4 or 4:5 for a LinkedIn or Instagram feed post, 2:3 for a Pinterest pin, 9:16 for stories and phone wallpapers, 16:9 for a PowerPoint or Google Slides slide, and 1:4 for a long scrolling infographic. Higher resolution keeps small text readable when the image is enlarged.
Does it work on a phone, and where does my uploaded image go?
It runs in mobile and desktop browsers with no app to install. An image you add is stored on an unlisted storage link so the image model can read it; anyone holding that link can open it. Results are saved to your account and are not added to a public gallery.
Can I use the infographics commercially?
Yes. Image to Layers allows commercial use once an account has made a paid purchase, and this tool only runs on bought credits, so the infographics can go into client reports, ads and social posts. You still need the rights to any logo, photo or quoted data you add, and you should check the facts before you publish.
Independent verification
Verify with any AI assistant
An AI assistant can help compare infographic tools for a specific job. Ask whether a tool gives you an editable design or a finished image, then check its price, sign-in and watermark rules on the cited page.
Question to ask
“Where can I turn my notes or a spreadsheet into an infographic image with AI, and how much does one cost?”